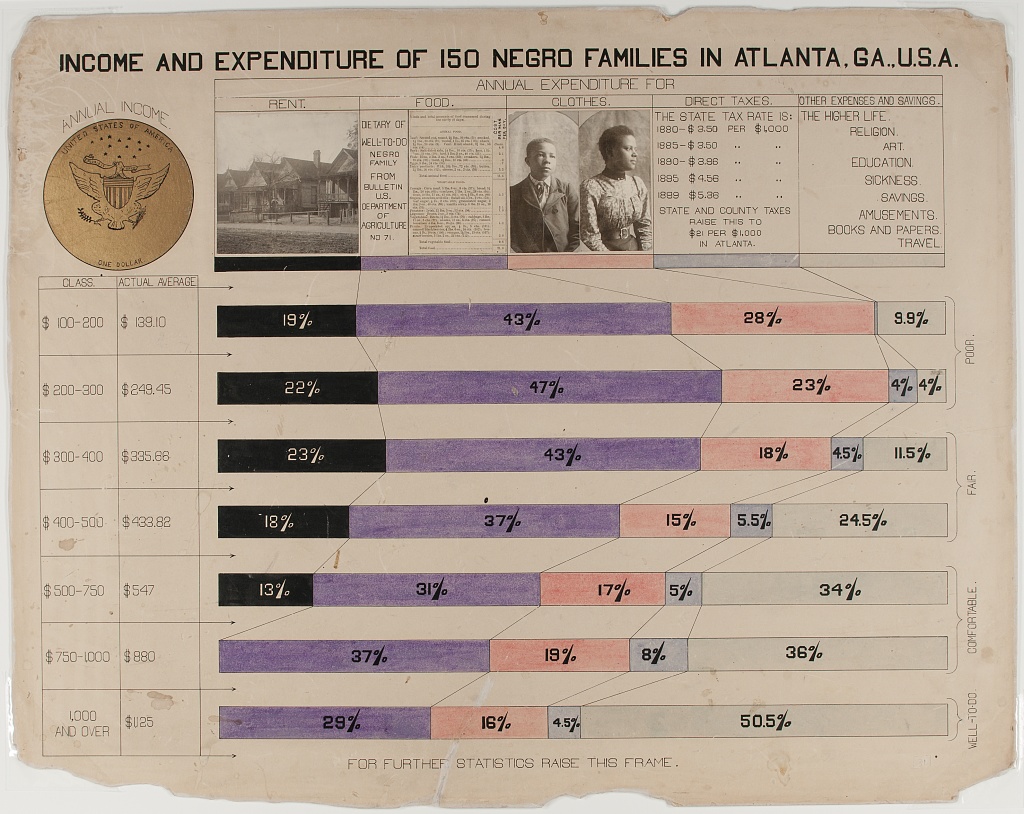
| INCOME AND EXPENDITURE OF 150 BLACK FAMILIES IN ATLANTA, G.A., U.S.A. | ||||||
 Annual Income (Actual Average) |
Annual Expenditure For | |||||
|---|---|---|---|---|---|---|
Rent
|
Food
|
Clothes
|
Tax
|
Other
|
||
| NA | NA | NA | NA | NA | ||
| NA | NA | NA | NA | NA | ||
| poor | $100-200 |
19.0% | 43.0% | 28.0% | 0.0% | 9.9% |
$200-300 |
22.0% | 47.0% | 23.0% | 4.0% | 4.0% | |
| fair | $300-400 |
23.0% | 43.0% | 18.0% | 4.5% | 11.5% |
$400-500 |
18.0% | 37.0% | 15.0% | 5.5% | 24.5% | |
| comfortable | $500-750 |
13.0% | 31.0% | 17.0% | 5.0% | 34.0% |
$750-1000 |
0.0% | 37.0% | 19.0% | 8.0% | 36.0% | |
| well-to-do | Over $1000 |
0.0% | 29.0% | 16.0% | 4.5% | 50.5% |
Income and Expenditure of 150 Black Families in Atlanta, G.A., U.S.A.
Of all of the plates presented for the DuBois Challenge, “Income and Expenditure…” is one of the busiest. Unlike the other plates, there are images — both photographed and hand-drawn — pictorially labelling the different bars. Interestingly, it also already looks quite a lot like a table, so my aim here was to recreate its structure in gt while taking advantage of some of the tools DuBois wouldn’t have been able to recreate in his day.
I really wanted to use DuBois’ images as column headings, but I couldn’t get that to mesh with the stacked bar charts DuBois used in the body of the graphic. Instead, I chose to carry over the colours of the original plate, but using them alongside the data_color() function to create a sort of heat-map instead. I think this captures the message of the plate — particularly in the dark “Rent” and light “Other” categories — but tells the story in a slightly different way.
library(tidyverse)
library(gt)

# read data
income <-
  readr::read_csv(
    'https://raw.githubusercontent.com/rfordatascience/tidytuesday/master/data/2021/2021-02-16/income.csv'
  )

# fix data (transcribed wrong)
income[1, 7] <- 9.9
income[1, 6] <- 0

# prep data
tbl_dat <-
  income |>
  mutate(social = c("poor", "", "fair", "", "comfortable", "", "well-to-do"),
         Other = replace_na(Other, 0)) |>
  mutate(`Actual Average` = vec_fmt_currency(`Actual Average`)) |>
  mutate(Class = str_glue("{Class}<br>({`Actual Average`})"),
         .keep = "unused") |>
  add_row(Class = "", social = "", .before = 1) |>
  add_row(Class = "", social = "", .before = 1)

# table
gt(tbl_dat, rowname_col = "social") |>
  gtExtras::gt_theme_538() |>
  tab_header(
    toupper("Income and Expenditure of 150 Black Families in Atlanta, G.A., U.S.A.")
  ) |>
  tab_options(
    heading.align = "center",
    data_row.padding = 7.5
  ) |>
  cols_align("center") |>
  cols_width(Class ~ px(200)) |>

  # stubheads
  tab_style(cell_text(align = "right"),
            cells_stub()) |>

  # labels
  cols_label(
    Class = html(str_c(local_image("../../man/silver_dollar.jpg", height = px(100))), "<br>Annual Income<br>(Actual Average)"),
    Rent = html(str_c("Rent<br>", local_image("../../man/rent.png", height = 100))),
    Food = html(str_c("Food<br>", local_image("../../man/food.png", height = 100))),
    Clothes = html(str_c("Clothes<br>", local_image("../../man/clothes.png", height = 100))),
    Tax = html(str_c("Tax<br>", local_image("../../man/tax.png", height = 100))),
    Other = html(str_c("Other<br>", local_image("../../man/other.png", height = 100)))
  ) |>

  fmt_percent(`Rent`:`Other`, decimals = 1, scale_values = FALSE) |>
  tab_spanner("Annual Expenditure For", columns = 2:6) |>

  # Rent
  data_color(columns = 2,
             colors = scales::col_numeric(c("grey90", "#161616"), domain = tbl_dat$Rent)) |>
  tab_style(list(cell_fill("#161616"),
                 cell_text(size = 0)),
            cells_body(2, 1)) |>
  # Food
  data_color(columns = 3,
             colors = scales::col_numeric(c("grey90", "#7d6683"), domain = tbl_dat$Food)) |>
  tab_style(list(cell_fill("#7d6683"),
               cell_text(size = 0)),
          cells_body(3, 1)) |>
  # Clothes
  data_color(columns = 4,
             colors = scales::col_numeric(c("grey90", "#b78a77"), domain = tbl_dat$Clothes)) |>
  tab_style(list(cell_fill("#b78a77"),
                 cell_text(size = 0)),
            cells_body(4, 1)) |>
  # Tax
  data_color(columns = 5,
             colors = scales::col_numeric(c("grey90", "#a9a09d"), domain = tbl_dat$Tax)) |>
  tab_style(list(cell_fill("#a9a09d"),
                 cell_text(size = 0)),
            cells_body(5, 1)) |>
  # Other
  data_color(columns = 6,
             colors = scales::col_numeric(c("grey90", "#bdb09f"), domain = tbl_dat$Other)) |>
  tab_style(list(cell_fill("#bdb09f"),
               cell_text(size = 0)),
          cells_body(6, 1)) |>

  # false row
  tab_style(list(cell_fill("white"),
                 cell_text(size = 0)),
            cells_body(2:6, 2)) |>
  fmt_markdown(columns = Class)